
BuddhistCatholicContemplativeEvangelicalGeneral ChristianHinduJewishLatter-day SaintMuslimNew VisionsProgressive Christian
Beliefs
- Buddhist
- Catholic
- Contemplative
- Evangelical
- General Christian
- Hindu
- Jewish
- Latter-day Saint
- More Voices
- Muslim
- New Visions
- Pagan
- Progressive Christian
Topics
- Religion News
- Food and Religion
- Sports and Religion
- Religious Art
- Religious Music and Entertainment
- Religious Events
- History and Religion
- Style and Religion
- Politics and Religion
- Women in Religion
- Recreation Outdoors and Religion
- Business Finance and Religion
- Careers Workplace and Religion
- Education and Religion
- Family Parenting and Religion
- Health Fitness and Religion
- Home and Religion
- Relationships and Religion
- Technology and Religion
- Travel and Religion
Columnists
- Buddhist Columnists
- Business Finance and Religion Columnists
- Careers Workplace and Religion Columnists
- Catholic Columnists
- Contemplative Columnists
- Education and Religion Columnists
- Evangelists Columnists
- Family Parenting and Religion Columnists
- General Christian Columnists
- Health Fitness and Religion Columnists
- Hindu Columnists
- History and Religion Columnists
- Home and Religion Columnists
- Jewish Columnists
- More Voices Columnists
- Latter Day Columnists
- Muslim Columnists
- New Visions Columnists
- Nonreligious Columnists
- Pagan Columnists
- Politics and Religion Columnists
- Progressive Columnists
- Recreation Outdoors and Religion Columnists
- Relationships and Religion Columnists
- Religion News Columnists
- Religious Art Columnists
- Religious Events Columnists
- Religious Music and Entertainment Columnists
- Sports and Religion Columnists
- Style and Religion Columnists
- Technology and Religion Columnists
- Travel and Religion Columnists
- Women in Religion Columnists
Resource Library
- 2026 Calendar
- Library of World Religions
- The 100 Most Holy Places on Earth
- Patheos Answers
- Podcasts
- Videos
- Faith Leaders Database
- Anglican Episcopalian
- Bahai
- Baptist
- Buddhism
- Christianity
- Confucianism
- Eastern Orthodoxy
- Hinduism
- Holiness and Pentecostal
- ISKCON
- Islam
- Judaism
- Lutheran
- Methodist
- The Church of Jesus Christ of Latter-day Saints
- New Age
- Paganism
- Presbytarian and Reformed
- Protestantism
- Religion Behind the Scenes
- Roman Catholic
- Scientology
- Shia Islam
- Sikhism
- Sufism
- Sunni Islam
- Taoism
- Zen
- See all religions
Research Tools
 Ad-Free & Subscriber Log-In Subscription Support
Ad-Free & Subscriber Log-In Subscription Support
Follow Patheos 

- Trending:
- Forgiveness
- |
- Marriage
- |
- Consciousness
- |
- Death Penalty
- |
- Election
- |
- Halloween

- Home
- Catholic
- Politics and Religion
- The statistics on abortion and social class
The statistics on abortion and social class
Last updated on: May 17, 2019 at 2:58 pm by Jane the Actuary
The statistics on abortion and social class 2019-05-17T14:58:17-06:00 Jane the Actuary
Patheos Explore the world's faith through different perspectives on religion and spirituality! Patheos has the views of the prevalent religions and spiritualities of the world.
https://en.wikipedia.org/wiki/March_for_Life_(Washington,_D.C.)#/media/File:March_for_Life,_Washington,_D.C._(2013).JPG; By Miss.Monica.Elizabeth – Own work, CC BY-SA 3.0, https://commons.wikimedia.org/w/index.php?curid=25829162
So in my prior post, I observed that the conventional wisdom that “the only people who get abortions are those experiencing hardship, and that means poor women” is not necessarily true. I pulled out some statistics from a study I had read which suggested that middle class women are just as likely to abort, but, after having published that post, I wanted to check the reliability of that study (which draws the conclusion, “poor women aren’t having as many abortions as they should, so for equality reasons we should make the procedure more widely available and free!” so there could have been a bias toward finding what they wanted to find. With that in mind, here’s how the Brookings scholars did their math in “Sex, contraception, or abortion? Explaining class gaps in unintended childbearing.”
To begin with, their data source was the National Survey of Family Growth from 2011 – 2013. This survey includes 10,416 men and women from ages 15 – 44. For their study, they actually wanted to look specifically at women at risk of unintended pregnancy, so they narrowed this group down to “single women not trying to get pregnant,” a group of 3,885 women in total. It’s reasonable enough to exclude women who describe themselves as actively trying to get pregnant, and they rationalize the exclusion of married women because they may be “less cautious about contraception” and “more likely to continue with an unintended pregnancy” and because “marriage is also correlated with income.”
They then divide the women into multiple groups by income level. They don’t explicitly state whether this is household income or individual income and, looking at the questionnaire, I can’t actually find the applicable question. Of course, for a single woman on her own it doesn’t matter, and maybe, in any case, survey-takers don’t count as “household income” that of an unmarried cohabitating partner, but you’d think it would make a difference for teens and young adults who are still dependents.
They assess whether there is a difference in frequency of sexual activity by income group, and conclude the answer is “no” (though, as I griped in my original 2015 blog post, they use as the marker having had sex at least once in the past year when, of course, more frequent sex is duh connected up with more chances for pregnancy; they use this statistic because, so far as I can tell, this is all the survey asks, or, rather, it asks about number of partners but that doesn’t really get at frequency with a given partner.
They then identify that, in this subgroup, poor women are considerably less likely to say that they had used a method of contraception — 15.9% of poverty-level women and 14.6% of near-poor (100 – 200% of poverty level) said they had used “no method” of contraception in the past year; all other income groups were at less than 10%. This appears to me to be a strangely-high number, because “some method of contraception at some point in the past year” seems a pretty low bar to clear, but, again, since the survey group includes anyone who reported having sex even a single time at any point in the past year, maybe not.
Then then calculate the pregnancy rates for this group. Again, this is not a rate for all women of childbearing age, but for all single women who report not actively seeking to get pregnant, and is in response to the question of whether they were pregnant at any point in the past year.
And, finally, of the women who said they were pregnant, they calculate the proportion of them for whom the pregnancy ended in abortion. My chart from the prior post backed out of this division with multiplication.
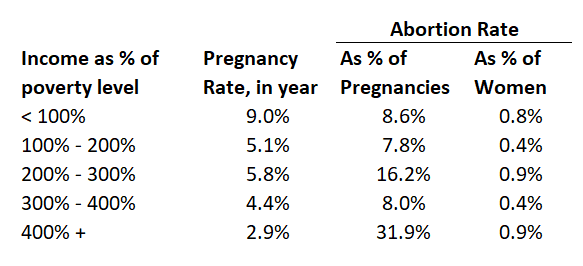
But there is another study which is cited much more often, using Guttmacher data, which comes up with a much higher prevalence of abortion among poor women.
The most recent set of calculations were published in the American Journal of Public Health in 2017 (also available at the NIH website) but use 2014 data (which is a bit later than the NSFG from 2011 – 2013 and maybe there’s a bit of a difference due to changes in just these few years, as the abortion rate has been decreasing, but I don’t know that this helps understand things).
This study used data from three sources: the Guttmacher Institute’s 2014 Abortion Patient Survey (APS), the American Community Survey (ACS), and the NSFG. The APS is based on surveys of abortion clinics, who were themselves asked to survey women getting abortions, by asking women to privately fill out questionnaires. These questions asked about demographic characteristics, union status, and “poverty” (it doesn’t say income level, but the numbers don’t make sense unless they also asked about income level and family size more generally so as to be able to classify people in income buckets). Because the study also needed to know the prevalence of women in each category, they used the ACS and the NSFG for these overall characteristics.
The results for this study are rather different — I’ve added them to the prior table (the third rate is the rate for all women with incomes over 200% FPL).
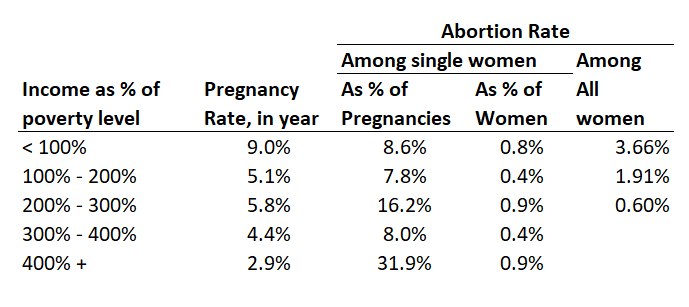
Also, the total abortion rate for all women of childbearing years was 1.46%.
So why on earth are these two statistics so different?
The statistical breakdowns in the AJPH data explain the motivation the Brookings scholars had in excluding married women, as it is this group which had the lowest abortion prevalence:
- Married, 0.55%
- Cohabitating unmarried 3.1%
- Neither married nor cohabitating, 1.7%
Because women of middle-class and upper-middle-class income levels are far more likely to be married, this could explain to at least some degree why the rates for “percent of single women not trying to get pregnant” vs. “all women” differ. According to the American Community Survey, as analyzed by the Institute for Family Studies, 26% of poor adults ages 18 – 55, 39% of working class adults, and 56% of middle and upper-class adults are married; and 13%/10%/5% respectively are cohabitating. But this adjustment accounts for some of the differences between the data, not all. Are there also differences in how women are classified, with respect to income group, with the APS overclassifying women as “poor” or the NSFG underclassifying them, for example, with women at abortion clinics more likely to exclude income from other family members in answering the question on “family income” or even with different definitions of what “family income” even is?
And none of this explains the broader discrepancy between these two data sources in terms of the overall abortion rates they calculate – 1.46% vs. something less than 1%..
So this is where I leave readers; I have no answer here, which is not particularly helpful, except to document that not every study gives the pat answer you’d like to have, which is itself a reminder to be skeptical of those studies which do claim simple answers.
Previous Post

May 17, 2019
Who are the real pro-lifers?
Next Post
May 19, 2019 The Game of Thrones insight you've all been waiting for
Browse Our Archives
Select a Category Actuarial/Retirement Issues Politics Uncategorized
Select a Month September 2026 August 2026 July 2026 June 2026 April 2026 March 2026 February 2026 January 2026 December 2025 November 2025 October 2025 July 2025 June 2025 May 2025 April 2025 March 2025 February 2025 January 2025 December 2024 November 2024 October 2024 September 2024 August 2024 July 2024 June 2024 May 2024 April 2024 March 2024 February 2024 December 2023 November 2023 October 2023 September 2023 August 2023 July 2023 December 2022 September 2022 August 2022 July 2022 June 2022 May 2022 February 2022 January 2022 December 2021 August 2021 June 2021 April 2021 February 2021 January 2021 December 2020 November 2020 October 2020 September 2020 August 2020 July 2020 June 2020 May 2020 April 2020 March 2020 February 2020 January 2020 December 2019 November 2019 October 2019 September 2019 August 2019 July 2019 June 2019 May 2019 April 2019 March 2019 February 2019 January 2019 December 2018 November 2018 October 2018 September 2018 August 2018 July 2018 June 2018 May 2018 April 2018 March 2018 February 2018 January 2018 December 2017 November 2017 October 2017 September 2017 August 2017 July 2017 June 2017 May 2017 April 2017 March 2017 February 2017 January 2017 December 2016 November 2016 October 2016 September 2016 August 2016 July 2016 June 2016 May 2016 April 2016 March 2016 February 2016 January 2016 December 2015 November 2015 October 2015 September 2015 August 2015 July 2015 June 2015 May 2015 April 2015 March 2015 February 2015 January 2015 December 2014 November 2014 October 2014 September 2014 August 2014 July 2014 June 2014 May 2014 April 2014 March 2014 February 2014 January 2014 December 2013 November 2013 October 2013 September 2013 August 2013 July 2013
Follow Us!
TAKE THE
Religious Wisdom Quiz
True or False: Proverbs 31 describes the characteristics of a godly husband.
Select your answer to see how you score.
TRUE FALSE
Related posts from Jane the Actuary

The ERA of 1972 no longer exists in...

What's A Pro-Life Illinoisan To do?
The Violinist vs. the Castaway, and an attempt...
On the end of Roe, and why I'm...
TRENDING AT PATHEOS Catholic

Emotion in Early Christianity by Andrew Crislip
Andrew Crislip’s Emotion in Early Christianity examines an often overlooked dimension of...

16 Spiritual Touchstones for a More Grounded Life
After decades of spiritual study, here are 16 principles I try...

Catholic Evangelization: Sharing Your Faith Every Day
Welcome back to the Graceful Awakening mini-series called, “From Faith to Mission.” ...

The Pillar of the Boatmen: the Ancient Monument...
The Pillar of the Boatmen is a Romano-Gaulish sculpture that dates from...

In one sense walking into Westminster Abbey is like walking down the...

'Super Scam Me' Exposes AI Jon Bon Jovi...
Leslie Pickett believed she was in a relationship with Jon Bon Jovi....
view all Catholic blogs
Ad-Free & Subscriber Log-In Subscription Support
- About Us
- 2026 Calendar
- Videos
- Podcasts
- Library of World Religions
- Faith In Media Tracker
- Advertise With Us
- Write for Us
- Privacy Policy
- Terms of Service
- Do Not Sell My Data
- Contact Us
- Radiant Digital
- Manage Newsletter Subscriptions
- Unsubscribe From Notifications
- Sitemap
Copyright 2008-2026, Patheos. All rights reserved.
Subscription Support Ad-Free & Subscriber Log-In
Follow Patheos